 isketch
GitHub
Open the editor
Sketch it. Hand it to your agent.
Sketch the system → Copy for AI → your agent builds it → the diagram stays true.
A whiteboard that thinks in text: every diagram is also .flow source a coding
agent reads exactly, and can write back.
Try it right here
The real editor, one click away. Drag a shape, rename it, connect two: nothing to install, nothing to sign.
From sketch to built
A sketch becomes a brief, the brief becomes code, the code updates the sketch. That is the whole loop, in one short clip.
The loop, in four steps
Architecture, database, UI screens or flows, hand-drawn look and all.
Copy for AI puts a structured brief on your clipboard. Or share a link the agent can read.
Services, tables, components: names and relationships read exactly, not guessed from pixels.
The agent edits the diagram back as the code changes, and pull requests show the diff.
What your agent receives
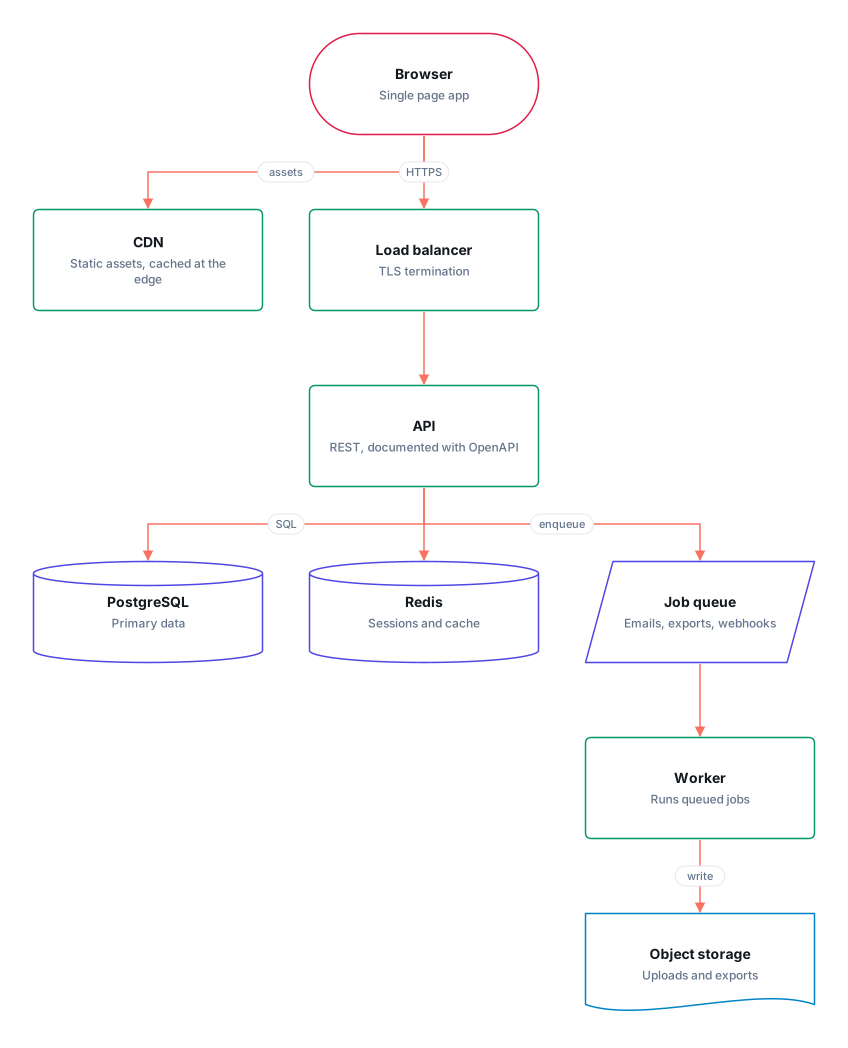
The same diagram above, as the brief an agent reads. Copy it, paste it into Claude, Copilot or Cursor, and ask for the services it names.
# Web app architecture

A design sketched in isketch: 9 shapes and 8 connections. Build from it, and refer to shapes by their ids. To change the diagram, edit the source at the end and hand it back.

## Shapes

- **Browser** `browser`: where a flow starts or ends, or something outside the system. Single page app
- **CDN** `cdn`: a component or step. Static assets, cached at the edge
- **Load balancer** `lb`: a component or step. TLS termination
- **API** `api`: a component or step. REST, documented with OpenAPI
- **Job queue** `queue`: data going in or out. Emails, exports, webhooks
- **PostgreSQL** `db`: a data store. Primary data
- **Redis** `cache`: a data store. Sessions and cache
- **Worker** `worker`: a component or step. Runs queued jobs
- **Object storage** `files`: a file or document. Uploads and exports

## Connections

- **Browser** → **CDN**: assets
- **Browser** → **Load balancer**: HTTPS
- **Load balancer** → **API**
- **API** → **PostgreSQL**: SQL
- **API** → **Redis**
- **API** → **Job queue**: enqueue
- **Job queue** → **Worker**
- **Worker** → **Object storage**: write

## Source

The same diagram in the `.flow` format: `id = shape "Name" -- description`, `id note: ...`, `id color: blue` (red, orange, yellow, green, teal, blue, violet, pink, grey), `a -> b : label` (`-->` dashed, `<->` both ways), and positions under `@layout`.

```text
title: Web app architecture

browser = terminal "Browser" -- Single page app
cdn = process "CDN" -- Static assets, cached at the edge
lb = process "Load balancer" -- TLS termination
api = process "API" -- REST, documented with OpenAPI
queue = data "Job queue" -- Emails, exports, webhooks
db = database "PostgreSQL" -- Primary data
cache = database "Redis" -- Sessions and cache
worker = process "Worker" -- Runs queued jobs
files = document "Object storage" -- Uploads and exports

browser -> cdn : assets
browser -> lb : HTTPS
lb -> api
api -> db : SQL
api -> cache
api -> queue : enqueue
queue -> worker
worker -> files : write

@layout
browser 276,0
cdn 0,176
lb 276,176
api 276,352
queue 552,528
db 0,528
cache 276,528
worker 552,704
files 552,880
```
Ask any agent for a sketch
Ask your agent to explain something with an isketch sketch, and point it at this site. It writes the diagram as text, puts it in a link, and you open the link to see it. No account, no API key, no install. Agents: read /llms.txt; it says how.
Or meet your agent where it works
An MCP server gives the agent the diagrams itself: list, read, update, redraw. Locally over stdio, or over HTTP from the server in the repository, run on your own host.
claude mcp add isketch -- node /path/to/isketch/bin/isketch.mjs mcp .
claude mcp add --transport http isketch https://your-server/mcp